Candlestick Charting
Harami - A harami is a reversal pattern that is the opposite of an
engulfing pattern. A small opposite color body is within a larger body at the top or
bottom of a move. It indicates that the trend has lost momentum.

| Pattern |
|
A very large black body is followed by a small white body and
is contained within the black body. |
|
| Interpretation |
|
A bullish pattern when preceded by a downtrend. |
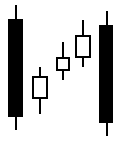
Bearish 3

| A long black body followed by several small bodys and ending
in another long black body. The small bodys are usually contained within the first black
body's range. |
|
| Interpretation |
|
A bearish continuation pattern. |
Bearish Harami

| Pattern |
|
A very large white body followed by a small black body that
is contained within the previous bar. |
|
| Interpretation |
|
A bearish pattern when preceded by an uptrend. |
Bearish Harami Cross

| Pattern |
|
A Doji contained within a large white body. |
|
| Interpretation |
|
A top reversal signal. |
Big Black Candle

| Pattern |
|
An unusually long black body with a wide range. Prices open
near the high and close near the low. |
|
| Interpretation |
|
A bearish pattern. |
| Big White
Candle |
|
 |
| Pattern |
|
A very long white body with a wide range between high and
low. Prices open near the low and close near the high. |
|
| Interpretation |
|
A bullish pattern. |
| Black Body |
|
 |
| Pattern |
|
This candlestick is formed when the closing price is lower
than the opening price. |
|
| Interpretation |
|
A bearish signal. More important when part of a pattern. |
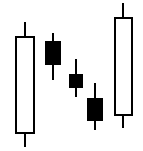
| Bullish 3 |
|
|
| Pattern |
|
A long white body followed by three small bodies, ending in
another long white body. The three small bodies are contained within the first white body.
|
 |
| Interpretation |
|
A bullish continuation pattern. |
| Bullish Harami |
|
|
| Pattern |
|
A very large black body is followed by a small white body and
is contained within the black body. |
 |
| Interpretation |
|
A bullish pattern when preceded by a downtrend |
| Bullish Harami
Cross |
|
 |
| Pattern |
|
A Doji contained within a large black body. |
|
| Interpretation |
|
A bottom reversal pattern |
| Dark Cloud
Cover |
|
 |
| Pattern |
|
A long white body followed by a black body. The following
black candlestick opens higher than the white candlestick's high and closes at least 50%
into the white candlestick's body. |
|
| Interpretation |
|
A bearish reversal signal during an uptrend. |
|
| Doji |
|
 |
| Pattern |
|
The open and close are the same. |
|
| Interpretation |
|
Dojis are usually components of many candlestick patterns.
This candlestick assumes more importance the longer the verticle line. |
| Doji Star |
|
 |
| Pattern |
|
A Doji which gaps above or below a white or black
candlestick. |
|
| Interpretation |
|
A reversal signal confirmed by the next candlestick (eg. a
long white candlestick would confirm a reversal up). |
| Engulfing
Bearish Line |
|
 |
| Pattern |
|
A small white body followed by and contained within a large
black body. |
|
| Interpretation |
|
A top reversal signal. |
| Engulfing
Bullish Line |
|
 |
| Pattern |
|
A small black body followed by and contained within a large
white body. |
|
| Interpretation |
|
A bottom reversal signal. |
| Evening Doji
Star |
|
 |
| Pattern |
|
A large white body followed by a Doji that gaps above the
white body. The third candlestick is a black body that closes 50% or more into the white
body. |
|
| Interpretation |
|
A top reversal signal, more bearish than the regular evening
star pattern. |
| Evening Star |
|
 |
| Pattern |
|
A large white body followed by a small body that gaps above
the white body. The third candlestick is a black body that closes 50% or more into the
white body. |
|
| Interpretation |
|
A top reversal signal. |
| Falling Window |
|
|
| Pattern |
|
A gap or "window" between the low of the first
candlestick and the high of the second candlestick. |
 |
| Interpretation |
|
A rally to the gap is highly probable. The gap should provide
resistance |
| Gravestone Doji
|
|
 |
| Pattern |
|
The open and close are at the low of the bar. |
|
| Interpretation |
|
A top reversal signal. The longer the upper wick, the more
bearish the signal. |
| Hammer |
|
 |
| Pattern |
|
A small body near the high with a long lower wick with little
or no upper wick. |
|
| Interpretation |
|
A bullish pattern during a downtrend |
| Hanging Man |
|
 |
| Pattern |
|
A small body near the high with a long lower wick with little
or no upper wick. The lower wick should be several times the height of the body. |
|
| Interpretation |
|
A bearish pattern during an uptrend. |
| Inverted Black
Hammer |
|
 |
| Pattern |
|
An upside-down hammer with a black body. |
|
| Interpretation |
|
A bottom reversal signal with confirmation the next trading
bar. |
| Inverted Hammer |
|
 |
| Pattern |
|
An upside-down hammer with a white or black body. |
|
| Interpretation |
|
A bottom reversal signal with confirmation the next trading
bar. |
| Long Legged
Doji |
|
 |
| Pattern |
|
A Doji pattern with long upper and lower wicks. |
|
| Interpretation |
|
A top reversal signal. |
| Long Lower
Shadow |
|
 |
| Pattern |
|
A candlestick with a long lower wick with a length equal to
or longer than the range of the candlestick. |
|
| Interpretation |
|
A bullish signal. |
| Long Upper
Shadow |
|
 |
| Pattern |
|
A candlestick with an upper wick that has a length equal to
or greater than the range of the candlestick. |
|
| Interpretation |
|
A bearish signal |
| Morning Doji
Star |
|
 |
| Pattern |
|
A large black body followed by a Doji that gaps below the
black body. The next candlestick is a white body that closes 50% or more into the black
body. |
|
| Interpretation |
|
A bottom reversal signal. |
| Morning Star |
|
 |
| Pattern |
|
A large black body followed by a small body that gaps below
the black body. The following candlestick is a white body that closes 50% or more into the
black body. |
|
| Interpretation |
|
A bottom reversal signal. |
| On Neck-Line |
|
 |
| Pattern |
|
In a downtrend, a black candlestick is followed by a small
white candlestick with its close near the low of the black candlestick. |
|
| Interpretation |
|
A bearish pattern where the market should move lower when the
white candlestick's low is penetrated by the next bar. |
|
| Piercing Line |
|
 |
| Pattern |
|
A black candlestick followed by a white candlestick that
opens lower than the black candlestick's low, but closes 50% or more into the black body. |
|
| Interpretation |
|
A bottom reversal signal. |
| Rising Window |
|
 |
| Pattern |
|
A gap or "window" between the high of the first
candlestick and the low of the second candlestick. |
|
| Interpretation |
|
A selloff to the gap is highly likely. The gap should provide
support. |
|
| Separating
Lines |
|

Uptrend |

Downtrend |
| Pattern |
|
In an uptrend, a black candlestick is followed by a
white candlestick with the same opening price. In a downtrend, a white
candlestick is followed by a black candlestick with the same opening price. |
|
| Interpretation |
|
A continuation pattern. The prior trend should resume. |
| Shaven Bottom |
|
 |
| Pattern |
|
A candlestick with no lower wick. |
|
| Interpretation |
|
A bottom reversal signal with confirmation the next trading
bar. |
| Shaven Head |
|
 |
| Pattern |
|
A candlestick with no upper wick. |
|
| Interpretation |
|
A bullish pattern during a downtrend and a bearish pattern
during an uptrend. |
| Shooting Star |
|
 |
| Pattern |
|
A candlestick with a small body, long upper wick, and little
or no lower wick. |
|
| Interpretation |
|
A bearish pattern during an uptrend. |
| Spinning Top |
|
 |
| Pattern |
|
A candlestick with a small body. The size of the wicks is not
critical. |
|
| Interpretation |
|
A neutral pattern usually associated with other formations. |
| Three Black
Crows |
|
 |
| Pattern |
|
Three long black candlesticks with consecutively lower closes
that close near their lows. |
|
| Interpretation |
|
A top reversal signal. |
| Three White
Soldiers |
|
 |
| Pattern |
|
Three white candlesticks with consecutively higher closes
that close near their highs. |
|
| Interpretation |
|
A bottom reversal signal. |
| Tweezer Bottoms
|
|
 |
| Pattern |
|
Two or more candlesticks with matching bottoms. The size or
color of the candlestick does not matter. |
|
| Interpretation |
|
Minor reversal signal. |
| Tweezer Tops |
|
 |
| Pattern |
|
Two or more candlesticks with similar tops. |
|
| Interpretation |
|
A reversal signal. |
|
| White Body |
|
 |
| Pattern |
|
A candlestick formed when the closing price is higher than
the opening price. |
|
| Interpretation |
|
A bullish signal |
Piercing line and Black Cloud Cover - This is a
bullish reversal pattern that has a long green body that pierces through the
midpoint or higher of a long red body. This occures after a downtrend. It is
similar to a bullish engulfing pattern except that the bulls did not show up in complete
force to completely engulf the previous day's move.


![]()


